Production plan. Planning costs for the "implementation of production stages." Calculation of the plan
See this section for a detailed example of calculating a business plan for the construction of a 12-story residential complex. The example shows approaches to planning stages of construction work and provides useful recommendations to simplify the process and improve the quality of planning.
In this example, the bulk of the costs are described in a Gantt chart. Here you will learn how to prepare data for a Gantt chart, for example, how to create a summary table of data - stages of a production plan. The example shows methods for structuring costs, how to prepare a table for cost structure analysis, etc.
And if you have a non-cyclical project, use this example and the recommendations from this example to prepare your business plan.
Some operational plans can not be initially standardized, as their content depends on the company's activities. Such plans include the "Cost plan for the implementation of production stages", which is created in the program based on the user's directory:
| Directories | Tables |
| Directory product | Sales plan |
| Directory materials and standard costs | Procurement plan and regulatory costs |
| Directory of Resources and Production Steps | Cost plan for the implementation of production stages |
| Directory of fixed costs | Plan fixed costs |
If in MS Project the Gantt chart is the main planning tool, in "Budget-Plan Express" the main goal for the Gantt chart is to get the "cost plan for realization of production stages" table. For this, after editing the Gantt chart, you need to perform the final calculation: "Data → Calculate → "Gantt chart"". Same thing - F9.
Budget-Plan Express is a software product for preparing business plans and presentations in Word and Excel format, optimal for small businesses and studies (for students, graduate students, MBI students, etc.)
Build a financial model for your project using the Gantt chart! Try the new version of the program (6.02). Details ...
☛ Note that the "Gantt chart" and the "Cost plan for the implementation of production stages" are calculated simultaneously. After performing the calculation, all tasks from the Gantt chart (their cost) will be distributed according to the articles of "resources" in the table "costs for the realization of the production stages".
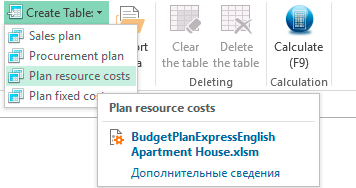
After the directory of "resources and production phases" has been finally edited, select the menu item: "Data → Create table → Plan of production costs" and follow the instructions...
 If you have had errors when creating the directory, the program displays a message, and in some cases will go to the line that contains the error:
- Error in directory! The attribute [total] must be in a single instance;
- Error in directory! You can not set the [sum] property for adjacent attributes;
- Error in directory! Select a property for the attribute from the list;
- Error in directory! The first attribute must have the [element] property;
- Error in directory! The last attribute must have the [total] property.
 If there are no errors, the program will offer a choice:
-
1. 'Yes' - to save old table data;
2. 'No' if the old table should be completely deleted;
3. 'Cancel'.
Example of calculation of the production plan of construction of a 12-storey 3-sectional residential complex
☛ The example demonstrates approaches to planning the stages of construction and installation works, gives useful recommendations for simplifying the process and improving the quality of planning.
Let's say that the total useful area of the 12-storey 3-sectional dwelling house is 9753.12 sq.m. (36 one- and two-bedroom apartments with an area of 38.71 and 67.51 sq. m., and 72 three-room apartments with an area of 82.35 sq. m.). It is proposed to build a network schedule of construction and installation works, calculate the cost of the stages. Calculate the estimated cost of construction and installation works. To build an analytical table of the structure of estimated costs, to compare the cost structure with the average Russian standards.
The summary estimate report is also important for analyzing the cost structure in percentages, and in this example it will be demonstrated. So, for example, the construction of a multi-apartment apartment house assumes roughly the following cost structure (on average in Russia in 2016):
- Total costs. The cost of construction of 1 square. m is: panels and monoliths - 25-30 thousand rubles, bricks - 30-35 thousand rubles.
- Rent of land - from 6 to 15% of construction costs.
- The project design, approval and expertise account for less than 3-7% of the cost.
- Connection and construction of external engineering networks, approximately 10% of the cost.
- Construction and installation work accounts for 60 to 75% of the cost of housing construction (including a box, 29-40%, foundations 8-15%, internal engineering networks 15-20% finishing - 15-18%, roofing - 5-10%, improvement - 3-8%)
☛ Note that the description of a business plan construction using Gantt charts that are linked to it cost structure – is the most quick and effective way to develop financial table. The reason is that using the Gantt chart, not only important milestones are described, but almost all construction costs, with the exception of some costs: land (from 6 to 15% of construction costs), credit load (about 10-15%), marketing (3-10%), the contents of the device (3-8%).
Stage 1. Create a Data Pivot Table
Before creating a Gantt chart, it is recommended to compile a summary table of the "Production Plan Milestones". In the table, you need to specify for each task (stage) implementation time, basic costs, clarify the formation of costs, as well as the contents of the directory "resources and production stages."
It is on the basis of the directory that a cost table will be created, therefore, the content of the analysis depends on how the cost table is structured. In the above example, two options for directory are suggested: abbreviated and more detailed. In the first case, it is planned to create a table of "consolidated stages of construction", which resembles the "Consolidated Estimate Report", often used in the analysis of construction projects.
☛ Note that the directory (cost table) must not exceed 30 lines, taking into account the summing rows.
Table example "Stages of the production plan"
| № | Task name | Duration | Start | End | Refinement | Table of "resources and production stages" (consolidated stages of construction) | Table of "resources and production phases" (detailed construction stages) | Basic costs |
| 1. | PROJECT OF CONSTRUCTION OF A RESIDENTIAL 12-STOREY HOUSE | 440 дн | 11.01.16 | 15.09.17 | - | - | - | 216 387 251 |
| 2. | 1. Design, coordination, expertise | 120 days | 11.01.16 | 24.06.16 | Expertise and licensing documents, coordination of project documentation, development of working documentation | Design, coordination, expertise | Design, coordination, expertise | 11 703 744 |
| 3. | 2. PREPARATORY WORKS | 30 дн | 27.06.16 | 05.08.16 | - | - | - | 3 795 000 |
| 4. | Preparing the construction site | 30 days | 27.06.16 | 05.08.16 | Preparation of the territory. Site withdrawal, breakdown of axes, construction site fencing, temporary water supply, temporary electricity and lighting, toilet, reinforcement polygon and warehouse | Preparatory work | Site preparation and installation | 2 500 000 |
| 5. | Installation of construction equipment | 30 days | 27.06.16 | 05.08.16 | Installation of a concrete plant, installation of a tower crane, lifts and elevators, other equipment | Preparatory work | Site preparation and installation | 1 295 000 |
| 6. | 3. MAIN STEPS OF CONSTRUCTION AND INSTALLATION WORKS | 260 days | 08.08.16 | 04.08.17 | - | - | - | 91 758 596 |
| 7. | Ditch | 30 days | 08.08.16 | 16.09.16 | Volume: 2048 m3 (65.24 x 15.7 x 2). Excavation excavation: 240 x 2048 m3 = 491 520. Removal and utilization of soil: 270 x 2048 m3 = 552 960. Other costs = 443 544 | Foundation | Ditch | 1 488 024 |
| 8. | Foundation | 50 days | 19.09.16 | 25.11.16 | Exploring the soil and designing the foundation. Installation: foundation plate, drilled piles, basement floor beams, concrete floors, drainage, etc. | Foundation | Foundation | 16 620 442 |
| 9. | Building a "box" at home | 120 days | 28.11.16 | 05/12/17 | Concrete, iron frame, brick, cement, tile, machinery operation, work, other | Building a "box" at home | Building a "box" at home | 51 504 336 |
| 10. | Stairways, platforms | 90 days | 27.12.16 | 01/05/17 | Ladder march with a platform = (8,820 + 6,200) х 78 = 1,171,560. Plots = 8,500 х 78 = 663,000. Installation = 5200 х 78 + 4900 х 78 = 405,600. Other costs = 300,000 | Stairways, platforms, garbage chutes | Stairways, platforms | 2 922 360 |
| 11. | Refuse chutes | 20 days | 05.15.17 | 09.06.17 | Trunk of the garbage collection assembly for a 12-story building = 142 000 x 3 = 426 000. Installation = 110 000 x 3 = 330 000 | Stairways, platforms, garbage chutes | Refuse chutes | 756 000 |
| 12. | Roof | 60 days | 05.15.17 | 04.08.17 | Mounting prefabricated elements of the roof attic, engine room for elevators and roofing panels. Stacking insulation. Installation of prefabricated elements: ventilation units, extracts of sewer risers and garbage chute, water intake funnels, television and radio antenna stands, etc. | Roof device | Roof device | 7 607 434 |
| 13. | Installation and commissioning of elevators | 30 days | 05.15.17 | 06/23/17 | Passenger elevators with a capacity of 400 kg. on 4 = 1,300,000 x 3 = 3,900,000. Elevators with a capacity of 1000 kg. at 4 = 1 600 000 x 3 = 4 800 000. The cost of installation = 360 000 x 6 = 2 160 000 | Mounting elevators | Mounting elevators | 10 860 000 |
| 14. | 4. FINISHING WORKS | 60 days | 15.05.17 | 04.08.17 | - | - | - | 25 602 983 |
| 15. | Facade Finishing | 30 days | 05.15.17 | 06/23/17 | Scope of work: installation of scaffolding, fixing plaster mesh, plastering, putty, priming, painting the facade 2 times with water-dispersion paint. Price (works + materials), rubles / units. amend. 2 646 sq.m. = 2,284 × 5827.68 | Facades | Facade Finishing | 7 482 741 |
| 16. | Other facade work | 20 days | 05.15.17 | 09.06.17 | Mounting of metal structures (installation of drainpipes, installation of castings, installation of balcony patches) = 370 400. Foundation work and foundation (materials and work) = 1 276 480 | Facades | Facade Finishing | 1 646 880 |
| 17. | Internal finishing of living quarters | 60 days | 05.15.17 | 04.08.17 | Wallpaper: wall area of 28,080 square meters. m, materials and work (185) = 28 080 x 185 = 5 194 800. Laying of the tile: 6450 x 144 = 928 800. Ceilings: an area of 9753.12 square meters. m = 9753.12 x 270 = 2 633 342.4. The floor in the kitchen (lenolium): an area of 432 square meters. m = 432 х 488 = 210 816. Floor (laminate): the area of 9 321.12 square meters. m = 9 321.12 x 360 = 3 355 603.2. Other costs = 1 400 000 | Finishing | Finishing work taking into account materials: wallpaper gluing; facing works; painting works; the device of polymeric floors; laying laminate; plastering works | 13 723 362 |
| 18. | Decoration of common premises | 30 days | 05.15.17 | 06/23/17 | Types of works: plastering works; Painting works; facing works; installation of windows; door installation; other work | Finishing | Finishing works taking into account materials: plastering works; Painting works; facing works; installation of windows; door installation; other work | 2 750 000 |
| 19. | 5. INSTALLATION OF TECHNOLOGICAL CONSTRUCTIONS | 45 days | 15.05.17 | 14.07.17 | - | - | - | 13 696 560 |
| 20. | Windows, glazing and balcony doors | 45 days | 05.15.17 | 14.07.17 | Price with installation: windows = 7 680 x 468 = 3 594 240, glazing = 6 400 x 144 = 921 600, balcony doors 5 900 X 144 = 835 200 | Finishing | Installation of technological structures | 5 365 440 |
| 21. | Interior doors | 30 days | 05.15.17 | 06/23/17 | Price with installation: 468 x 4 700 = 2 199 600 | Finishing | Installation of technological structures | 2 199 600 |
| 22. | Apartment doors | 20 days | 05.15.17 | 09.06.17 | Price with installation: 144 x 7 200 = 1 036 800 | Finishing | Installation of technological structures | 1 036 800 |
| 23. | Bathroom and other plumbing fixtures | 30 days | 05.15.17 | 06/23/17 | Price with installation: Bathroom = 7 900 x 144 = 1 137 600, Sink = 3 200 x 144 = 460 800, Mixers = 3 500 x 144 = 504 000, Cranes and siphons = 3 100 x 144 = 446 400, Toilet bowl = 3 480 x 144 = 501 120 | Finishing | Installation of technological structures | 3 294 720 |
| 24. | Electric stove | 15 days | 05.15.17 | 02.06.17 | Price with installation: 9 500 x 144 = 1 368 000 | Finishing | Installation of technological structures | 1 800 000 |
| 25. | 6. INTERNAL NETWORKS AND COMMUNICATIONS | 60 days | 15.05.17 | 04.08.17 | - | - | - | 31 193 200 |
| 26. | Installation of wiring and equipment systems | 45 days | 05.15.17 | 14.07.17 | Layout in accordance with the approved project; Drilling walls, laying cables, wiring; installation of electrical equipment and accessories; commissioning | Internal networks and communications | Installation of wiring and equipment systems | 8 593 200 |
| 27. | Installation of water supply, heating and sewerage systems | 60 days | 05.15.17 | 04.08.17 | Laying of hot cold water supply system, installation of radiators. Installation of special equipment - pumps, valves, network membrane tanks, etc. Connect to the dispatching system | Internal networks and communications | Installation of wiring and equipment systems | 16 900 000 |
| 28. | Installation of other utilities | 60 days | 05.15.17 | 04.08.17 | Internal networks and communications | Installation of wiring and equipment systems | 5 700 000 | |
| 29. | 7. GASKET AND CONNECTION TO ENGINEERING NETWORKS | 120 days | 20.02.17 | 04.08.17 | - | - | - | 29 259 360 |
| 30. | Laying and connection to electrical networks and communication networks | 90 days | 13.03.17 | 14.07.17 | Laying of power supply networks: cable line, cable duct, outdoor lighting. Construction of emergency power plant, electrical equipment, automatic fire extinguishing. Laying of communication networks, radio communications, elevator control networks. Connecting the house to the mains and communication networks | External networks | Laying and connection to electrical networks and communication networks | 7 979 825 |
| 31. | Laying and connection to water supply and sewerage networks | 120 days | 20.02.17 | 04.08.17 | Laying of temporary engineering networks (water supply). Laying of external main water supply networks, outdoor water supply network (area networks), laying of external sewerage and storm sewage | External networks | Laying and connection to electrical networks and communication networks | 11 969 738 |
| 32. | Laying and connection to heating networks | 120 days | 20.02.17 | 04.08.17 | Conclusions with the heat supply organization of the connection contract. Laying the heating network, reconstruction of the heating network in existing channels | External networks | Laying and connection to electrical networks and communication networks | 9 309 796 |
| 33. | 8. IMPROVEMENT | 75 days | 15.05.17 | 25.08.17 | - | - | - | 8 527 808 |
| 34. | Landscaping and gardening | 30 days | 05.15.17 | 06/23/17 | Outdoor lighting. Provision of intraquarter thoroughfares and turning areas for cars, guest car parks, playgrounds and playgrounds, sites with green stripes, pedestrian paths, dog walking areas, garbage disposal, etc. | Accomplishment | Accomplishment | 8 177 808 |
| 35. | Disassembly of temporary structures | 15 days | 07/08/17 | 08/25/17 | Dismantling of temporary structures, technological and special equipment. Removal of fasteners, lifting of dismantled equipment, disconnection of process pipelines, etc. | Accomplishment | Accomplishment | 350 000 |
| 36. | 9. Commissioning of the project | 15 days | 08/28/17 | 09/15/17 | Cleaning, sweeping the building inside, washing the windows. Minor and unforeseen expenses | Putting the object into operation | Putting the object into operation | 850 000 |
☛ Note that the number of project stages is limited (not more than 40 stages).
Stage 2. Creating directory "resources and stages of production" and the table "Plan production costs"
Cost Table Structure
Estimates of costs (costs), for example, in construction projects, this is a grouping of information about expenses for the purpose of analyzing the structure of costs and the associated risks.
In this regard, first of all you need to understand - who is the end user of your project (business plan): investor (bank), developer or contractor, or partner.
If, for example, data for a business plan are compiled on the basis of estimates, in this case it is advisable to take into account the structure of estimates in order to use the estimates in the cost table. In other words, the huge amount of costing work that has been done can be useful in generating data for a resource table. And in this case, the structure of the data used should be close in content (in this case, reflect the structure of the estimated estimated cost). For example, in the resource method, costs take into account types of work, operation of machinery and mechanisms, labor costs of workers, etc. In this case, the cost structure may be close to estimates of production costs (see table). Or the cost structure may determine the cost of construction at different stages.
| Example 1. Production costs | Example 2. The cost of construction at different stages |
| material costs | design work |
| wages and insurance premiums | construction and installation works (direct construction work) |
| equipment, depreciation | work on the introduction of the object operation |
| other expenses | other expenses |
An example of a reference book whose structure is close to the structure of the cost estimates for production
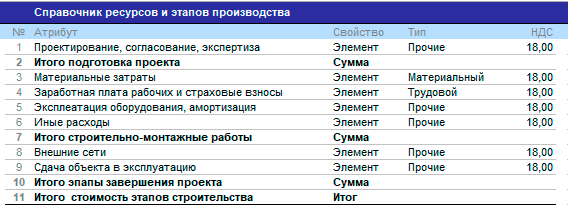
☛ Note that in the "Plan of production costs" is formed an incomplete cost, this plan does not include fixed costs. A plan of fixed (fixed) costs is made up additionally. But as a rule, direct costs in such projects can be up to 90% or more of all costs.
Directory [1] "resources and production stages"
In the columns PivotTable (7,8) proposed cost items to display "integrated phases" and to the more detailed stages of construction. Pages "Directories" create a directory "resources and production stages", or importing from a dynamic named range, if you have already created it. Create a directory, displaying structure of "integrated phases" (see column 7 of the PivotTable).
![create a directory of resources and production stages Reference [1] resource accounting and stages of production. Planning Budget-Plan Express](img.files/help-075-gantt-chart-edit4-english.gif)
In summing lines, you need to specify the corresponding property ("sum" or "total").
The "Type" column indicates one of three cost types: "Material", "Labor" or "Other". In our case, all the rows indicate the cost type 'other', as the cost of the stages includes material and labor costs. In small projects (for example, the construction of cottages), costs can be identified by cost groups, in large projects, cost-sharing by groups is not appropriate.
In the column "VAT" the tax percentage is set by default (in the settings). In this case the "incoming" VAT for both stages of works on which performing contractors and subcontractors. Also, it may be set incomplete VAT, for example, when the work is performed by our own construction crews. In this case, we need to calculate the VAT in the cost stage. For example, if the value of "interior trim" includes the cost of the work is 30% (done on their own, without VAT) and the cost of the materials – 70%, in this case, you must specify a VAT of 12.6% (18% x 0.7 = 12.6 percent) .
Similarly creates a directory with a more detailed cost structure. First create a directory (see column 8 of summary table).
Directory [2] "resources and production stages"
![Reference [2] resource accounting and stages of production Handbook with a more detailed cost structure. Planning Budget-Plan Express](img.files/help-075-gantt-chart-edit7-english.gif)
☛ Note, in one project you can use one of the directories, you can create two similar projects with different directories.
After the directory is created, you need to create the corresponding table "Cost plan for the implementation of production stages" from the main menu: "Data → Create table → Plan resource costs", as shown in the figure.
Stage 3. Creating Gantt charts
Let's create, according to the data presented in the summary table, the Gantt chart in the "Budget-Plan Express". If you are used to working in the MS Project program, you can create a Gantt chart there, then import it into the "Budget-Plan Express". When creating a Gantt chart in MS Project, remember the limitations (no more than 40 stages and no more than three nested levels).
Gantt chart: "Project to build a 12-storey 3-section apartment house". MS Project
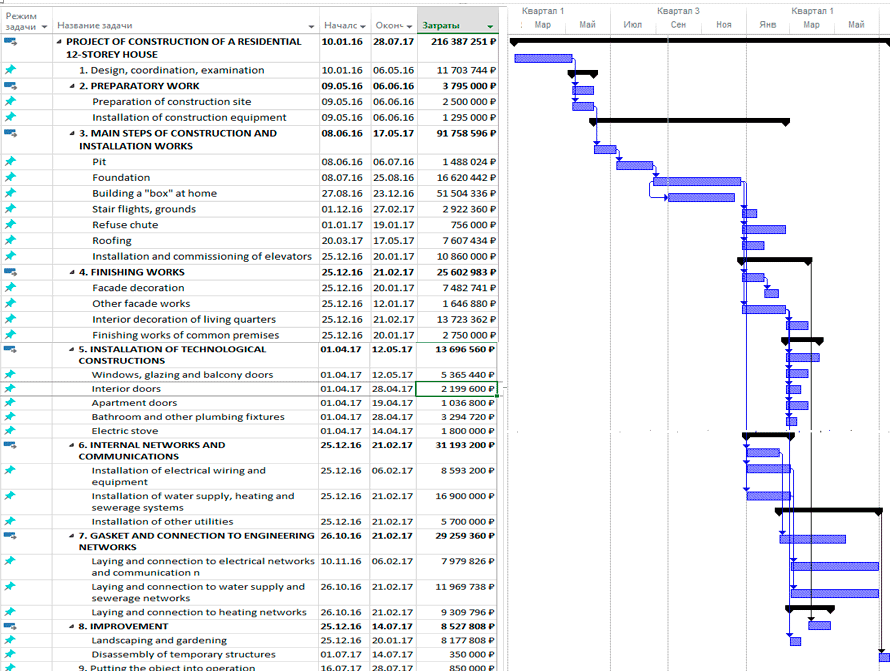
☛ Note that the structure of the stages (duration, start and end dates, nesting) is imported from MS Project quite simply. However, to import the cost, you need to create a resource sheet in MS Project and configure it according to the established rules (see "Exporting and importing Gantt charts - Exchange with MS Project").
Gantt chart: "Project to build a 12-storey 3-section apartment house". Budget-Plan Express
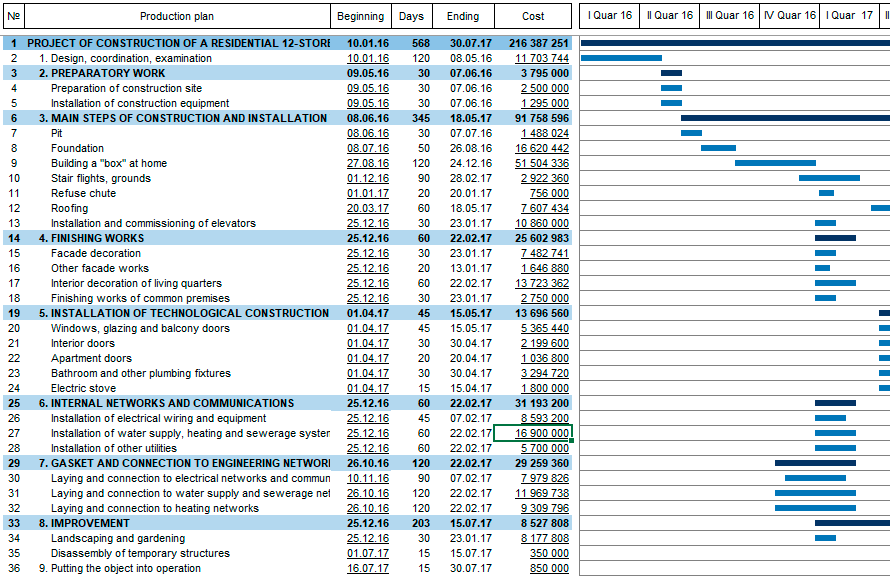
To edit the cost of the stage (tasks) of the Gantt chart, click on the corresponding link, then in the editing window, select the necessary resources in the list and indicate the amount, if necessary, the priority of the stage financing ("In the beginning", "Proportional", "At the end") as it shown on the picture. By default, a "Proportional" distribution of funds is established, that is, when the amounts are distributed evenly between the months, in proportion to the number of days (in a month).
Stage cost editing window
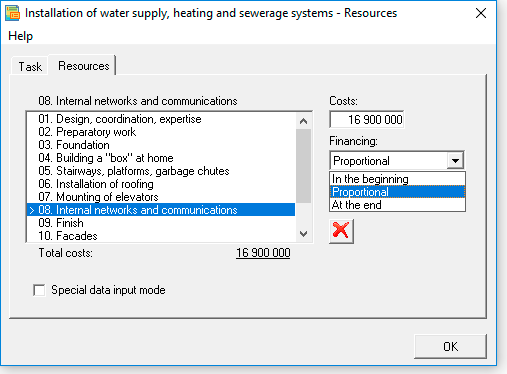
Pay attention, in this particular case, the cost of the stage is formed from several cost items. This example demonstrates how different resources can be taken into account in the cost of the stage, and the ultimate goal of this approach in cost planning is to obtain an analytical table where the costs will be structured, for example, by type of work. However, in fact, in large projects, such detailing is not practical. In large projects, monitoring the implementation of production stages in a timely manner is important. For example, if the contractor, at a certain time, undertakes to install plastic windows in a house under construction, and another contractor - the Internet, of course, in this case it is expedient to distinguish two "production processes" (in our case, two phases of the project).
Stage 4. Calculation of the table "Cost plan for the implementation of production stages"
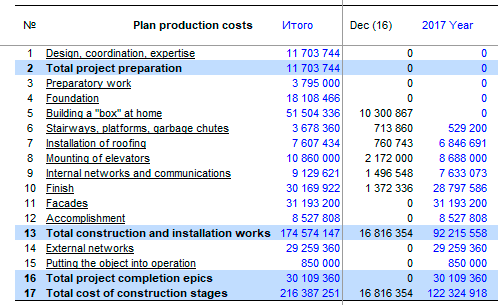
After editing the Gantt chart, perform the final calculation. The final calculation is performed from the main menu: "Data → Calculate → "Gantt chart"". Same F9.
Fragment of the calculation of the table "Cost plan for the implementation of production stages"
Fragment of the calculation of the table "Cost plan for the implementation of production stages" (detailed cost structure):
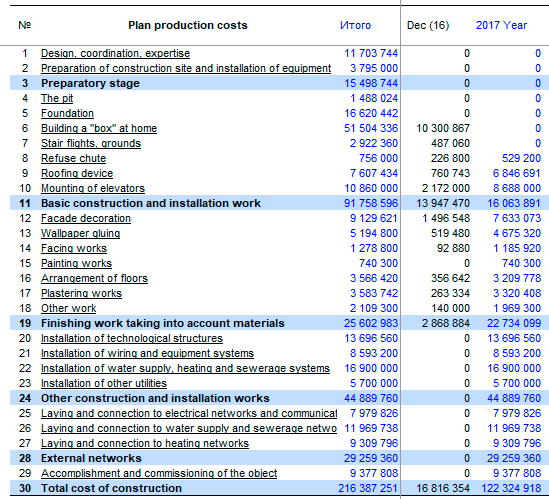
☛ Please note, in order to account for capitalization of costs, for example, in construction projects, a special interface with an editing form is used. In the editing form, you need to set the flag "investments in non-current assets". After calculating the balance, the costs will be included in the final value of the assets, where they will then be written off. See details "Example of capitalization of costs (reference to the value of non-current assets)". See also "Why in the program all costs, including targeted financing, are included in the profit and loss account".
Stage 5. The cost structure for the construction of the apartment building
The cost structure is not difficult to calculate from table "Plan production costs", the calculation will take the total costs for the entire period. Previously, export table "Plan production costs" in Excel: "Main menu → "Reports" → "Export to Excel" → "Export the current sheet"".
Summary budget calculation of cost of construction. Cost structure:
| Structure of the estimated cost | Sum | % |
| Registration of property rights to land and construction | 19 100 365 | 6,5 |
| Design, coordination, expertise | 11 703 744 | 4,0 |
| Construction and installation works, including: | ||
| Preparatory work | 3 795 000 | 1,3 |
| Foundation | 18 108 466 | 6,2 |
| "Box" | 51 504 336 | 17,6 |
| Stairways, platforms, garbage chutes | 3 678 360 | 1,3 |
| Roof installation | 7 607 434 | 2,6 |
| Mounting elevators | 10 860 000 | 3,7 |
| Internal networks and communications | 31 193 200 | 10,7 |
| Finishing | 30 169 922 | 10,3 |
| Facades | 9 129 621 | 3,1 |
| Accomplishment | 8 527 808 | 2,9 |
| Putting the object into operation | 850 000 | 0,3 |
| Total construction and installation work | 175 424 147 | 60,0 |
| External networks | 29 259 360 | 10,0 |
| Other associated costs, including: | ||
| Marketing and other commercial services | 8 977 808 | 3,1 |
| Contents of the device of the builder and other administrative services | 18 629 680 | 6,4 |
| Credit burden and other associated costs | 29 396 392 | 10,1 |
| Total Other Associated Costs | 57 003 880 | 19,5 |
| TOTAL | 292 491 496 | 100,0 |
In the structure of costs, above all, allocate the most costly stages, for which it is necessary to find sources of funds and to select financing schemes. In addition, the cost structure allows you to analyze the deviation of costs, for example, from the average Russian standards. Also, it is useful to compare the cost structure with a typical similar project, and in case of finding critical deviations from the norms, it is necessary to study in more detail the causes of these deviations.
The analysis of this example shows the compliance of the cost structure to the average Russian indicators, including construction costs of 1 sq. M. m, which is: 29,990 rubles. (cost of the project = 292 491 496, total area = 9753.12, cost of construction = 292 491 496 / 9753,12 = 29 990), we note that the average Russian indicator is 25-30 thousand rubles.
Also, it is useful to analyze the structure for construction and installation works, which account for, according to various estimates, 60 to 75% of construction costs. Also, there are more and less expensive articles inside the construction and assembly works that can be compared with the average Russian standards or with a typical similar project.
The structure of costs "inside" construction and installation works:
| Structure of estimated cost within construction and installation works | Sum | % |
| Preparatory work | 3 795 000 | 2,2 |
| Foundation | 18 108 466 | 10,3 |
| "Box" | 51 504 336 | 29,4 |
| Stairways, platforms, garbage chutes | 3 678 360 | 2,1 |
| Roof installation | 7 607 434 | 4,3 |
| Mounting elevators | 10 860 000 | 6,2 |
| Internal networks and communications | 31 193 200 | 17,8 |
| Finishing | 30 169 922 | 17,2 |
| Facades | 9 129 621 | 5,2 |
| Accomplishment | 8 527 808 | 4,9 |
| Putting the object into operation | 850 000 | 0,5 |
| TOTAL | 175 424 147 | 100,0 |
☛ Note that the analysis of the estimated costs by type of work, the technique used, by materials, taxes, etc., would be useful, for example, for a certain stage of construction in order to optimize cost management. At the same time, such an analysis, including all stages of construction and installation work, most likely would not make any practical sense from the point of view of planning and analysis of the cost structure.
Data analysis, financial tables and conclusions, as a rule, are accompanied by graphic visualization. There are two types of graphical representation of data: dynamic (horizontal) and structural (vertical).
The program includes standard modifications of graphs (about 70 modifications) of three types: "line", "histogram" and "circle". In our case, to create a graph that displays the data structure, you need to select a "histogram" or "circle".
To graph, you need to select the appropriate piece of data (in our case, a total column and all the costs of "construction work"), then select the type of graph: "Main menu → Reports → Histogram".
Construction and installation work. Cost structure:
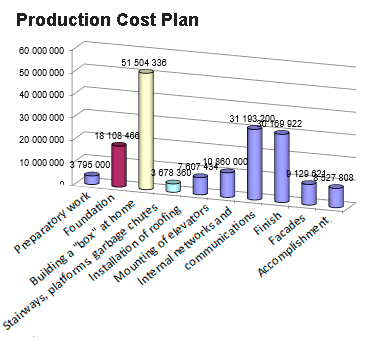
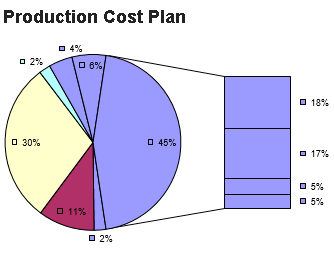
In the graphics editor of the program, you can change the modification of the graph in the menu item "Chart settings". Also, you can save the graph in raster formats (GIF or JPG) for later insertion into a text editor Word, PowerPoint, etc. See details in the section "Preparation of reports and business plans. Graphics".
☛ Note that the data can be transferred to Excel and build graphics there.
The acquisition and disposal of non-depreciable assets. Other associated costs
In the planning stages of construction, a large part of the cost (typically more than 90 % of the costs) are described in the Gantt chart. However, it is impossible and not correct to display all construction costs in the Gantt chart.
In the "Cost Plan for the implementation of production stages," the following costs are not taken into account:
-
1. Registration of property rights to land and buildings;
2. Marketing and other commercial services;
3. The contents of the machine Builder and other administrative services;
4. Credit load and other related costs;
5. Other associated costs.
Data cost categories are calculated in other plans. For example, the cost of "registration of property rights to land and the construction of" logical to describe in assets. See the "Example of an acquisition and write-off of non-depreciable assets".
The cost of "marketing and other business services" are usually described in terms of "fixed costs", credit load and other related costs associated with attracting credit resources in the "Financial plan" ("Credit products", "Operating and financial leases", "Reserves for future expenses" and "Placed equity instruments").
☛ Also, note that "other related costs" in the structure of costs for the construction of an apartment building are reflected in the periods of direct implementation of the project stages. For example, the project calculation period, including investment analysis, is 3 years (36 months), but the implementation of the construction stages, before commercial sales - 14 months. That is, in the summary table of the cost structure, the "other associated costs" are most logical to display in the periods from 1 to 14 months (14 months) of the project implementation.
Calculation of the table "Cost plan for the implementation of production stages"
The resources calculated in the "Plan of costs for the realization of the production stages" are included in the direct costs of the production plan. Here, in contrast to the "procurement and standard costs" plan, non-cyclical production costs are calculated. The Gantt chart and the "Cost Plan for Realization of Production Phases" are calculated simultaneously.
In the end, you will create a table of expenses for the implementation of production stages using the Gantt chart which is only an indirect representation of interfaces and data entry. The final calculation is performed from the main menu: "Data → Calculate → "Gantt chart" or "Plan production costs" (run simultaneously)". Same F9.
Example.
The example of calculation of the task "Examination of project documentation" (see screenshot) you can understand how the data from Gantt charts are transposed in tabular form:

In this example, the sum of the costs for implementation of stages of production (=150 000) is distributed in three periods (February, March, April), in proportion to the number of days in the period:

When allocating the total cost of a stage by periods, the calculation algorithm uses the start and end dates. That is, the program takes into account all days, including non-working days. At the same time, in the MS Project settings, by default, non-working days are excluded from the calculation. Synchronize time accounting in Budget-Plan Express and MS Project is not necessary, since it does not affect the calculations. However, if you want to enable non-working days in MS Project, change the settings: "Change working time → Set for the selected dates".
Applied and recommended procedures and functions
- If you deleted some data by mistake or performed the action, causing damage to data, exit the program without saving: "Main menu → Project file → quit without saving".
- If you exit the program, save the changes: "Main menu → Project file → Save" (or Ctrl+S). Or use the program exit with saving.
- Periodically back up the data: "Main menu → Project file → Save and backup" or Ctrl+Shift+S. File project saved in the folder "backup", the project name will display date and time of saving. To restore the file, just copy it in system folder («BPlanExpress»).
- If you have several projects (or calculation options), create a template file and, starting a new project, open the template file where your settings or preliminary project calculations are saved, select the menu item: "Main menu → Project file → To create a new project". This will shorten the development time of projects. ☛ Note that a new project is created in the system folder ("BPlanExpress"), which opens by default.
- Complete the final calculation: "Main menu → Data → Calculate". Same - F9.
- Clear table (reset values): "Main menu → Data → Clear table".
- Delete the table (delete all data and settings of the table settings): "Main menu → Data → Delete table".
- Clear the string (reset value): "Context menu (right mouse button) → Clear line."
- Translit: "Main menu → Settings → Translit text tables". Select the translation language.
- Export: "Main menu → Reports → Export to Excel". In the same place - export to Word.
- Financial and investment analysis. Settings parameters of project performance indicators:"Main menu → Settings → Investment analysis".
- Quick graph: "Context menu (right mouse button) → Graph of a line." Before the call, place the cursor anywhere in the row with the desired data. See also «Preparation of reports and business plans. Graphics».
