Plan fixed costs. Practical planning
Fixed cost planning algorithm
It is recommended to start planning fixed costs after planning of all major operating plans has been completed. It is also recommended to carry out preliminary calculations of operational plans, before you begin to form the financial part of the business plan, primarily for optimization and identification of possible errors.

The fixed cost plan is the last operational plan, the content of which depends on the activities of the company, that is, which is created in the program based on the user directory. Recall that fixed costs are costs that do not depend on the volume of products (rent, Internet operation, utilities, etc.).
 Budget-Plan Express is a software product for preparing business plans and presentations in Word and Excel format, optimal for small businesses and studies (for students, graduate students, MBI students, etc.)
Build a financial model of your project or calculate loan financing on different terms! Try the new version of the program (6.02). Details ...
☛ Please note that to prepare the directory, you need to think carefully about the contents of the table. It should reflect the analytical cost structure, depending on the planning goals (for example, by region, department, division, functional group, etc.)
Of all the operating plans, the fixed cost plan is the simplest, as only cost is planned. To prepare it, there is no need to use any complex planning tools. Nevertheless, the program has special tools that allow you to instantly fill in the series, using the trend of changes in value in future periods.
General planning algorithm
Enter the cost planning form. In the "cost planning" tab you will see fields in which you need to specify the cost - at the beginning and end of each year. You can use seasonal fluctuations here. You see the options "read trend from start value" and "read trend between start and end value". In the first case, the initial value will be interpolated according to the seasonality trend, in the second case, the initial and final values remain unchanged (see below for a detailed example in this section).
You can also set the "seasonal values for discrete trends" flag. It is worth explaining the purpose of this function. As a rule, fixed costs (as opposed to, for example, wholesale prices) change quite rarely, for example, once or twice a year the cost of rent or utilities can change, etc. These changes are called discrete (not cyclical).
Example planning step by step.
Rent planning. For example, the rental price will change annually, twice a year, for example, in the 5th and 12th months by 5%.
1. Set the "read the trend from the initial value" option.
2. Select the Seasonal Value for Discrete Trends check box.
3. Set the cost of rent at the beginning of the first year, for example, 20,000 rubles per month.
4. Now it remains to indicate seasonal changes - an increase in value by 5% in the 5th and 12th months.
5. Pull (move) the slider in the 5th month to a value of 5%. To set exact values, you can use the arrows (before that, activate the slider with the mouse).
6. And also move the slider in the 12th month - up to 10% (that is, another 5%).
7. Click the "calculate" button, click OK, and the row is instantly filled with data.
Just like that, you can fill in the cost series. We spent no more than a minute to fill in the row. You can see detailed examples further in this section.
8. And finally, after the plan of fixed costs has been fully formed, you need to do the following: go to the cost editing form (the first line in the table), select the cost distribution tab, and in the list, one by one, select products, and distribute costs between products ( in percentages).
Below you will see the final percentage, which should be 100%. You can also speed up the cost editing process. To do this, click the "copy" button and your settings will be copied (note) for subsequent costs.
The distribution of the cost of costs between products will allow, in the future, to carry out a break-even analysis for products. See “Costing Method in Costing” and “Margin and Break-Even Analysis”.
After finishing editing the plan, perform the calculation. The calculation is performed from the main menu: Data → Calculate → Fixed Cost Plan. The same is F9. As a result of this calculation, the fixed cost plan will be included in the final calculation of the business plan.
Practical examples and recommendations
The table contents should be verified and should reflect the basic structure of the fixed costs. Data tables typically are structured according to the different segments, depending on the planning purposes. In planning, the ordering of the data is called "data segmentation". For example, the data may reflect segments of the regions, departments (units) or functional cost groups. All user tables, including the "Plan fixed costs" is limited to the number of entries. The maximum number of records to "30". If necessary, you can use the aggregated data.
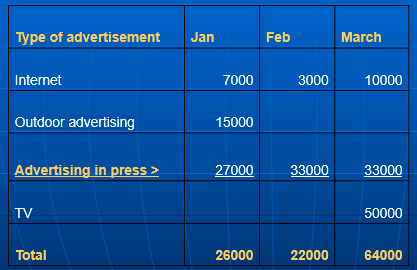
The following drawings by the example of advertising expenses (line 21), demonstrate – how to avoid excessive detail data:
In this example, the advertising cost plan (line 21) reflects the contents of the summary line shown in the table below.
An example of a table is the decomposition of a spending plan for advertising:
Calling the form editing
To call an edit form for the "fixed costs", click (single click) left click on the active link (as shown in the figure), the same F2.
Planning Tools
In terms of "fixed costs" data can be edited directly in the table, unlike other operational plans. For quick filling of the series, it is recommended to use a specially created tool that allows you to automatically fill in the row, taking into account the settings of the forecast trend.
Example of cost planning taking into account the forecast of the trend:
Use the interface tools to configure the calculation parameters. After setting the settings, click the "Calculate" button and the row will be filled in according to the settings. Refer to "forecast trends".
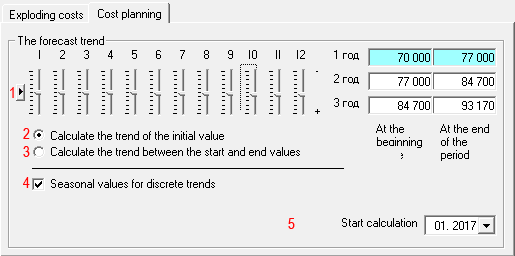
 Interface tools:
- Default values . The value of all the sliders (periods) equals zero.
- Calculate the trend from the initial value . The initial value is the starting point for calculating the trend. The subsequent values of the trend are calculated as the initial multiplied by the seasonality factor, without taking into account the seasonality factor in the first period:
Value of trendi = C1 + C1 × (Ai - A1)
Where:
Аi - the values of seasonality in i period;
С1 - value, beginning of period.
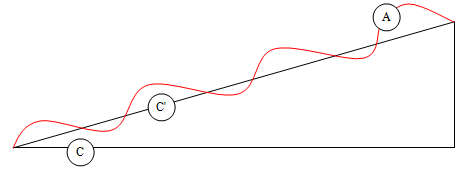
- Calculate the trend between the start and end values . Intermediate trend values are calculated as the moving average, multiplied by the seasonality factor:
Trend valuei = 'i ×i
Where:
Аi values of seasonality in i period;
С'i - values of the moving average i period;
Read more about moving averages, see moving averages and adjusted ranks of Budget-Plan Express.
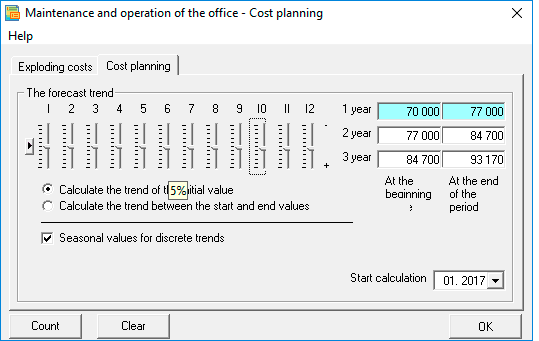
- Seasonal values for discrete trends. If the fluctuations of seasonality are not cyclical, check the box "Seasonal values for discrete trends". In this case, if seasonality changes (for example, in the 6th month), the subsequent seasonality (7-12 months) will take the same values.
In the example above, the value of 5% is set in the 6th month. Note - the same value (5%) was established in subsequent periods (7-12 months), since the checkbox "Seasonal values for discrete trends" is selected.
- Calculation start date . The period from which the trend is filled.
Example filling a row, taking into account the settings
As a rule, the forecast of fixed costs is not a cyclical trend, i.e., a change in prices occurs immediately, after which prices remain for a certain period of time. As an example, you can quote prices for utilities.
It is recommended, prior to planning, to write a table - a technical task, which would reflect the structure of fixed costs, corresponding to the objectives of the analysis for your business plan.
Example. Worksheet for planning fixed costs.
Suppose a business plan scenario. A small workshop for the production of cheese. The company uses a simplified tax system (6% of revenue). Start of production is scheduled for 2018. Wages will grow gradually, the first year - every 6 months, in the future - from the beginning of each year. The rental price is 70,000 at the beginning of the year, and every 6, 10 months - an increase of 5%. The Sales Officer will start work from the beginning of the 2nd year of the project. Own position of an accountant is not provided, it is assumed to be outsourced.
Here’s how a cost table could look like in this case:
| № |
Name of fixed costs |
2018 (1-6) |
2018 (7-12) |
2019 |
2020 |
| 1 |
Director |
20 000 |
30 000(+10000) |
50 000 |
60 000 |
| 2 |
Secretary |
20 000 |
30 000(+10000) |
32 000 |
35 000 |
| 3 |
Production technologist |
20 000 |
30 000(+10000) |
40 000 |
45 000 |
| 4 |
Total management personnel |
60 000 |
90 000 |
122 000 |
140 000 |
| 5 |
Working [2] |
40 000 |
50 000(+10000) |
60 000 |
60 000 |
| 6 |
Driver |
30 000 |
35 000(+5000) |
40 000 |
40 000 |
| 7 |
Other employees |
20 000 |
25 000(+5000) |
30 000 |
30 000 |
| 8 |
Total Executive staff |
90 000 |
110 000 |
130 000 |
130 000 |
| 9 |
Room rental |
70 000 |
+ 2% each. 6 m. |
- |
- |
| 10 |
Transport cost |
30 000 |
+5% per year |
- |
- |
| 11 |
Utility costs |
12 000 |
+5% per year |
- |
- |
| 12 |
Accounting expenses (outsourcing) |
5 500 |
5 500 |
5 500 |
5 500 |
| 13 |
Other expenses |
10 000 |
10 000 |
10 000 |
10 000 |
| 14 |
Total administrative expenses |
127 500 |
- |
- |
- |
| 15 |
Sales Officer |
0 |
0 |
40 000 |
45 000 |
| 16 |
Internet advertising, other advertising |
30 000 |
30 000 |
35 000 |
40 000 |
| 17 |
Other expenses |
10 000 |
10 000 |
10 000 |
10 000 |
| 18 |
Total selling expenses |
40 000 |
40 000 |
85 000 |
95 000 |
| 19 |
Total |
317 500 |
- |
- |
- |
It is convenient to use data from this table both for planning (in the program) and inserting it into the text of a business plan, when describing, for example, the staffing table.
Example table - shares (percentages) of products in operating profit and direct costs.
Percentages are used to allocate fixed product costs. If you use the ABC-method (Activity Based Costing) - a method of posting indirect (fixed) costs, simply use these percentages in the form of editing fixed costs (tab "exploding costs"). You can also, for posting product costs, use interest calculated from operating profit or from the ratio of direct costs.
| № |
Product name |
Operating profit |
Direct costs |
| Rubles |
% |
Rubles |
% |
| 1 |
Cheese firm "Russian new" |
60 369 900 |
59% |
34 596 340 |
58% |
| 2 |
Cheese pickle "Adygei" |
25 894 720 |
25% |
16 060 731 |
27% |
| 3 |
Cottage cheese "Classic" |
15 720 300 |
16% |
9 111 149 |
15% |
| 4 |
Total |
101 984 920 |
100% |
59 768 220 |
100% |
And, after editing, fixed costs will be included in the cost of products - in accordance with the specified shares (percent).
☛ In the future, these settings (cost distribution) will be used when calculating reports on products and when performing break-even analysis (Break-Even Analysis).
Example. Filling some costs for the rental of office space.
The annual lease payment at the beginning of the year established in the amount of 840 000. The company pays for renting office space on a monthly basis. Under the contract of rent, every 6 and 10 month the rent is increased by 5%.
- step . Set the option "Calculate the trend from the initial value";
- step . Check the box "Seasonal values for discrete trends" (if the box is not checked);
- step . Set the 6 month value to 5% , 10 month to 10% (i.e. e. + 5%). Please note, when editing 6 and 10 months, the following seasonality values were established: {0; 0; 0; 0; 0; 5 ; 5; 5; 5; 10 ; 10; 10}, since the "Seasonal values for discrete trends" check box is selected;
- step . Enter the corresponding value in the field at the beginning of "1 year": 70 000 (840 000/12 = 70 000). Please note that the values for the end of the year and 2, 3 years are set automatically .
 If you set the option "Calculate the trend between the start and end values" (instead of the option "Calculate the trend from the initial value"), then the value in each field is set by the user.
An example of ready settings for filling a row (1-4 steps) is shown in the figure:
An example of ready settings for filling a row (1-4 steps) is shown in the figure:
- step. Click "Calculate".
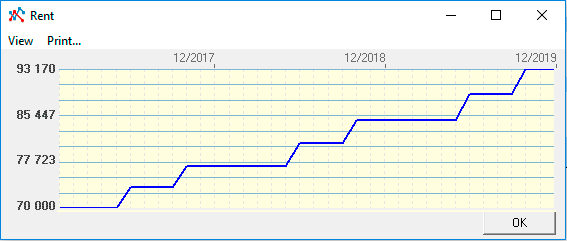
The chart of the result of the calculation "the cost of rental office space" (36 months):
Import of forecasted trends and exchange rates
The import procedure is invoked from the main menu: "Main menu → Data → Import data" - follow the instructions.
Read more about importing data from named ranges, see import data.
Distribution of costs included in the "fixed costs" plan, by products
The procedure "Distribution of costs by products", adjusts the costs in the "product report", where they are recorded as part of direct costs. Similarly, the form of cost adjustments is used in the table "Cost plan for the implementation of production stages".
The method of cost allocation includes the principles of the ABC / ABM (Activity Based Costing / Activity Based Management) methodology, which clarifies the cost estimates when referring directly to processes or the product.

The total percentage of all evaluations is always equal to 100%.
Distribution of costs by products - by steps:
- step. Activate the form - the tab "Distribution of costs";
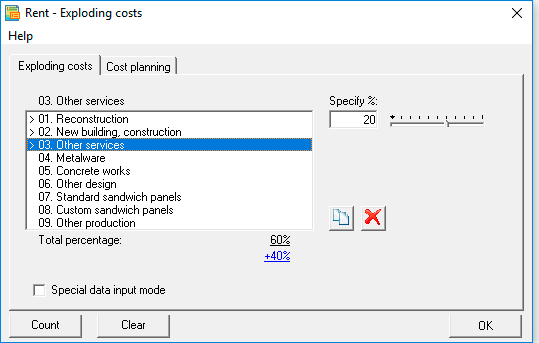
- step. Select from the list of necessary products and indicate the percentage of costs for this product - in the field, or with the help of the "runner". For the convenience of data entry, you can use the "special mode", as shown in the figure.
The form of "distribution of costs by products":
 Select your Budget-Plan Express licenses and pay in your personal account - in rubles or other currency
Applied and recommended procedures and functions
- If you deleted some data by mistake or performed the action, causing damage to data, exit the program without saving: "Main menu → Project file → quit without saving".
- If you exit the program, save the changes: "Main menu → Project file → Save" (or Ctrl+S). Or use the program exit with saving.
- Periodically back up the data: "Main menu → Project file → Save and backup" or Ctrl+Shift+S. File project saved in the folder "backup", the project name will display date and time of saving. To restore the file, just copy it in system folder («BPlanExpress»).
- If you have several projects (or calculation options), create a template file and, starting a new project, open the template file where your settings or preliminary project calculations are saved, select the menu item: "Main menu → Project file → To create a new project". This will shorten the development time of projects.
☛ Note that a new project is created in the system folder ("BPlanExpress"), which opens by default.
- Complete the final calculation: "Main menu → Data → Calculate". Same - F9.
- Clear table (reset values): "Main menu → Data → Clear table".
- Delete the table (delete all data and settings of the table settings): "Main menu → Data → Delete table".
- Clear the string (reset value): "Context menu (right mouse button) → Clear line."
- Translit: "Main menu → Settings → Translit text tables". Select the translation language.
- Export: "Main menu → Reports → Export to Excel". In the same place - export to Word.
- Financial and investment analysis. Settings parameters of project performance indicators:"Main menu → Settings → Investment analysis".
- Quick graph: "Context menu (right mouse button) → Graph of a line." Before the call, place the cursor anywhere in the row with the desired data. See also «Preparation of reports and business plans. Graphics».
Help about the program "Budget-Plan Express", www.strategic-line.ru | Help contents
Share:



 Interface tools:

