DuPont factor model. The five "factors" of return on equity (ROE)
DuPont analysis breaks down ROE into its constituent components to determine which of these factors are most responsible for the change in ROE.
Consider 1-2-3 and 5-factor Du Pont models, which are used to analyze the influence of various factors on the return on equity. Hence the name of the model - factorial model.
Modern factor models, which, by the way, are little known, cannot be compared in popularity with the Dupont factor model. Consistent success has seen the DuPont model become popular with all major US corporations. Today, DuPont analysis is known by many other names, including DuPont Equation, DuPont Framework, DuPont Identity, DuPont Model, DuPont Method, etc.

The name of the model comes from the name of the American chemical company "DuPont". But of course, this model has an author - Frank Donaldson Brown, and before Frank moved to the finance department in 1914, he worked for the company as an electrical engineer and could hardly have imagined that he would soon go down in history as an author popular method of financial analysis ...
The essence of the technique
The idea of the 1920s, which was based on a 2-factor model, was later modified into a factor model in the form of a tree structure, at the base of which is the return on equity (ROE) indicator, decomposed according to features characterizing operational and financial activity. Simply put, the factors affecting ROE are broken down in order to find out which of them, to a greater or lesser extent, affect the return on equity. The return on equity (ROE) formula is an indicator of the ratio of net income to equity:

The first decomposition of ROE into two factors is represented as a formula:

And here we can already highlight the return on assets (ROA), an indicator characterizing the quality of asset management. Now the ROE formula has an indicator that takes into account all assets, not just equity:

All these manipulations with indicators have no mathematical meaning, because you can always add or remove (reduce) any indicator, and the mathematical meaning will not change from this:

Another thing is important, adding a new indicator, now we consider it as a factor influencing the return on equity. And that's the whole point and simplicity of DuPont analysis.
Now let's move on to 3-factor and 5-factor models.
Budget-Plan Express is a software product for preparing business plans and presentations in Word and Excel format - for small businesses and studies (students, MBI students, etc.) More ...
DuPont's three-factor model
The following 3-factor model makes it possible to assess the impact of the capital structure on the return on equity. It is easy to understand that the lower the value of equity capital in the structure of the company's liabilities, the higher the return on equity.
The 3-factor model is represented by the following formula:


Here we have decomposed ROE into 3 indices, that is, we have built a three-factor ROE model. According to DuPont analysis, the return on equity is equal to the amount of profit multiplied by the asset turnover multiplied by the leverage. By dividing ROE (Return on Equity) into three parts, companies can more easily understand the changes in their ROE over time.
Profit margin is a measure of profitability. It is a measure of a company's pricing strategy and how well the company controls costs. Profit margin is calculated by finding net profit as a percentage of total revenue. As one feature of the DuPont equation, if a company's profitability increases, each sale generates more money in the company's bottom line, resulting in a higher overall return on equity.
DuPont's five-factor model
DuPont's five-step analysis includes two additional components, so the expanded 5-factor model is represented by the formula:

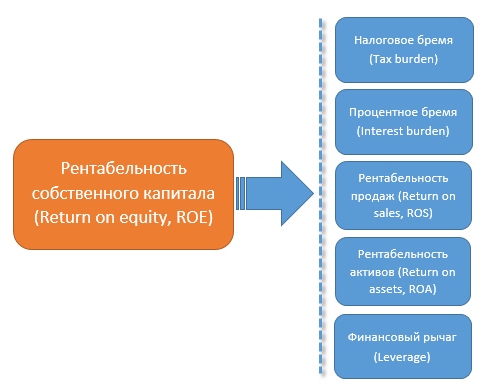
The decomposition of the return on equity into various factors is the ratios useful for companies in fundamental analysis, where:
1. Tax вurden.
2. Interest burden.
3. Return on sales.
4. Asset turnover ratio.
5. Leverage ratio.
Naturally, it is necessary to take into account the industry specifics. The percentage return on equity is best used to compare companies in the same industry.
Analysis is very important to the investor as it answers the question of what actually makes ROE what it is. If there is an increase in the bottom line without changing the leverage, it shows that the company can increase its profitability. But if a company can only increase its return on equity by increasing its financial leverage, it is risky because the company can increase its assets by raising borrowed funds.
Thus, we need to test whether the increase in the company's return on equity is due to an increase in net income or asset turnover (which is a good sign) or just leverage (which is a wake-up call).
Example DuPont Analysis with Leverage of 1
After examining the new DuPont concept, we must be wondering if this analysis is also being done for a company with no debt? Would this analysis be equally useful for a debt-free company?
An example of decomposition of ROE into 5 factors with financial leverage equal to 1:
| Indicator | jan | feb | march | apr | may | june | july | aug | sep | oct | nov | dec |
| Tax вurden | 0,76 | 0,76 | 0,76 | 0,76 | 0,76 | 0,76 | 0,76 | 0,76 | 0,76 | 0,76 | 0,76 | 0,76 |
| Interest burden | 0,89 | 0,87 | 0,85 | 0,86 | 0,84 | 0,84 | 0,85 | 0,89 | 0,89 | 0,88 | 0,85 | 0,86 |
| Return on sales | 0,29 | 0,35 | 0,35 | 0,34 | 0,39 | 0,23 | 0,17 | 0,28 | 0,29 | 0,35 | 0,35 | 0,28 |
| Asset turnover ratio | 0,56 | 0,53 | 0,52 | 0,55 | 0,48 | 0,29 | 0,35 | 0,26 | 0,35 | 0,40 | 0,34 | 0,25 |
| Leverage ratio | 1,00 | 1,00 | 1,00 | 1,00 | 1,00 | 1,00 | 1,00 | 1,00 | 1,00 | 1,00 | 1,00 | 1,00 |
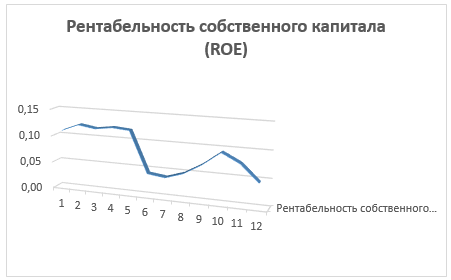
| Return on Equity (ROE) | 0,11 | 0,12 | 0,12 | 0,12 | 0,12 | 0,04 | 0,04 | 0,05 | 0,07 | 0,09 | 0,08 | 0,05 |

As the table shows, DuPont is equally useful in analyzing a company that is out of debt. The above formula remains the same, with one exception: the leverage component is assumed to be 1 and the rest remains the same. The graph shows the lowest ROE during the June to August periods. Thus, DuPont analysis can be carried out across all companies.
